
.jpg)
Average mortgage rates moved higher as the market absorbed the latest inflation data (a big jump in PCE) and flattish home prices (Case-Shiller). The US and Iran say that they are getting closer to a “deal” but we’ve heard this story before.
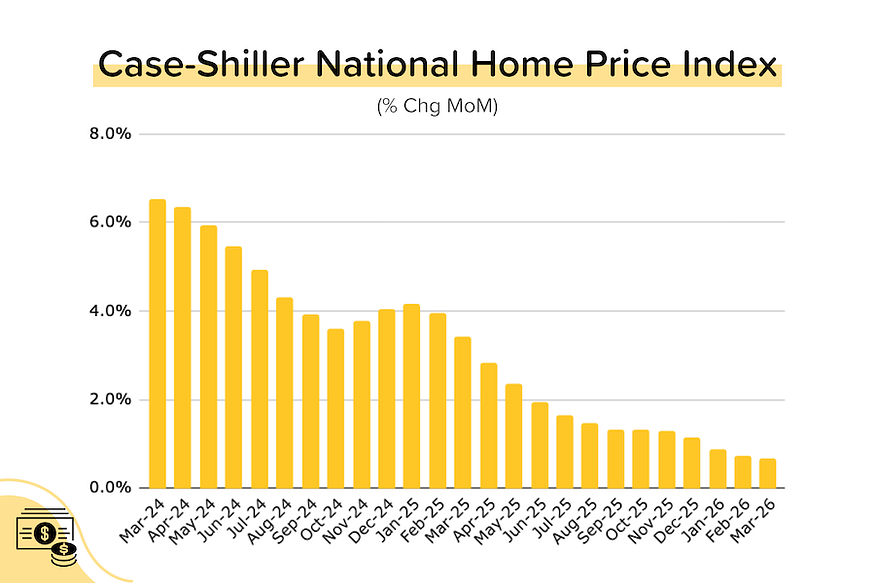
Case-Shiller: Home prices took a turn for the worse. Case-Shiller’s seasonally-adjusted national index fell 0.2% month-over-month in March, and annual growth decelerated further to +0.66% YoY (from 0.74% in February). Three-quarters of the big city indexes saw a MoM decline in March, and half of the indexes were down YoY. [More on this later]
TP: Remember, this data is from March — just after the US/Iran conflict began — but it also includes homes that were priced in January and February, when rates were much lower.
Weekly jobs growth slowed. ADP’s weekly “NER Pulse” reported that private job growth slowed to an average of +35,750 per week, down from +40,750 the week earlier. Both numbers suggest that ADP’s monthly report for May will come in around +130,000–140,000 — a significant improvement from +109,000 in April.

April PCE jumped, but less than feared. The bad news is that “headline” PCE (Personal Consumption Expenditures) jumped from +3.5% YoY in March → +3.8% YoY in April. The better news is that “core” PCE only rose from +3.2% in March → +3.3% in April. That said, “core” PCE has been accelerating for most of the last 18 months, and we’re far away from the Fed’s 2% target.

TP: Keep in mind, a lot of this rise has to do with the US/Iran war, higher oil prices, higher food prices etc.
The savings rate has plunged. This will be a surprise to no one that has filled their tank or bought groceries lately. With prices rising faster than wages, people are saving less. In April 2026, the personal savings rate (as a % of disposable income) dropped to 2.6%. A year ago, it was at 5.5%!

On the Case (Shiller) Again in March
Annual price growth for Case-Shiller’s seasonally-adjusted national index was basically flat at +0.7% YoY in March 2026. Year-over-year price growth has been decelerating for two years (was +6.5% YoY in March 2024).

As we do each month, we looked at the 20 Big City indexes in detail. Here’s what we found:
- 15 of the 19 big city indexes with available March data saw declines in their SA home price indexes in March 2026 (up from 11 in February and 5 in January). Detroit’s March data has not yet been released. [See bar chart below.]
- The largest price drops came from Seattle (-0.95% MoM), followed by Tampa (-0.75%), Los Angeles (-0.63%), Dallas (-0.52%), and San Diego (-0.52%).
- The largest price increases came from Chicago (+1.20% MoM), Boston (+0.57% MoM), Miami (+0.55% MoM), and New York City (+0.21% MoM). The strength in Midwest and Northeast metros continues to stand out.
- Ten of the 19 big cities with March data are seeing YoY price declines in their SA home price indexes. The steepest: Seattle (-2.47% YoY), Denver (-1.93% YoY), Tampa (-1.91% YoY), Dallas (-1.70% YoY), and Phoenix (-1.64% YoY).
- Only 4 cities made new all-time highs in March 2026: Boston, Chicago, Miami, and New York City.
- Seven cities’ price indexes are still below their mid-2022 peak levels: San Francisco (-6.1%), Denver (-4.0%), Seattle (-3.8%), Phoenix (-3.7%), Dallas (-3.3%), Tampa (-2.5%), and Portland (-2.4%).

Reminder: The Case-Shiller index is the gold standard for measuring home price growth because it uses the repeat sales method (looking at ‘pairs’ of transactions for the same home) to more accurately gauge true appreciation. However, this accuracy comes at a cost: a nearly two-month time lag.
Bond and Mortgage Market
According to Freddie Mac’s weekly PMMS survey, average 30-year mortgage rates edged higher from 6.51% last week to 6.53% this week. Mortgage News Daily, meanwhile, has average 30-year mortgage rates at 6.59% (5/28). As you can see below, the probability that the Fed keeps rates steady at its upcoming meetings has dropped. But that’s because the probability that the Fed is forced to RAISE interest rates has risen.
Note: The Fed Funds Rate policy range is currently 3.50–3.75%. The probabilities below come from the CME Group website and are implied from the Fed Funds Rate futures market.
- June 17 FOMC Meeting: This will be Kevin Warsh’s first meeting as the new Fed Chairman. 99% probability that the Fed Funds Rate will be kept at 3.50–3.75% (was 97% last week).
- July 29 FOMC Meeting: 91% probability that the Fed Funds Rate will be kept at 3.50–3.75% (was 84% last week) 9% probability that rates will be 25 basis points HIGHER than they are today.
- September 16 FOMC Meeting. 75% probability that the Fed Funds Rate will be kept at 3.50–3.75% (was 72% last week). A 23% probability that rates will be 25 basis point HIGHER than they are today (same as last week).
- Rate hikes in late 2026? If I look way out to the last FOMC meeting of the year (Dec 9), the market is pricing in a 52% probability (was 46% last week) that the Fed Funds Rate will be exactly where it is today. Additionally, the market is now pricing in a 48% probability that rates will be at least 25 basis points (and maybe 50 basis points) HIGHER by year-end.

They Said It
“The result is a housing market that seems to be improving based on headline indicators, but continues to operate below its norm and potential. Rising inventory has not translated into stronger sales because a significant share of that inventory does not align with the financial capacity of today’s buyers, even before factors like mortgage rate lock-in are considered.” — NAR Economics Team in The Housing Mismatch
.jpg)
.jpg)
.jpg)