
.jpg)
Threats, rescue missions, an ultimatum, and a ceasefire. The situation in the Middle East remains fragile and unpredictable. But back home, we got another big beat from the BLS, and an encouragingly typical Spring rise in inventory.
Big beat from the BLS jobs report. The BLS reported that the US economy added 178K jobs in March 2026. That was WAY ahead of expectations of around +60K. The unemployment rate also dropped from 4.4% to 4.3% (and was very nearly 4.2%). On the surface, this was a fairly strong report. But as usual, the deeper you dig, the more skeptical you get.

TP: This is the latest example of BLS numbers that just don’t feel right. First, we’ve got ADP reporting private jobs growth of just 40–60K per month. Second, the decline in the unemployment rate was mostly due to a 400K drop in the labor force. Why? No idea. Third, the February job loss was revised from -92K to -133K. Just look at the monthly volatility in the BLS jobs numbers (yellow line) in the graph above!
Still (strangely) very optimistic. According to data provider Cotality, home prices were flat MoM in March, and up only 0.5% YoY. Yet this hasn’t stopped them from maintaining a forecast for 4.7% price growth over the next 12 months.
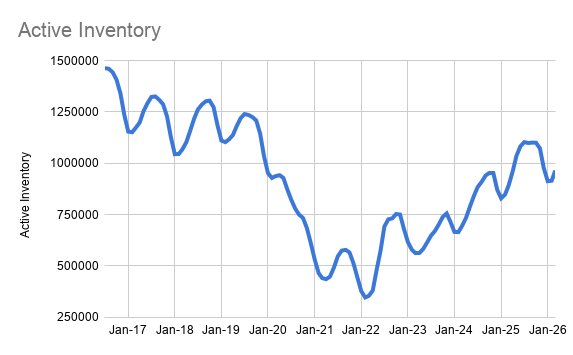
A fairly normal March for housing inventory. Real estate is seasonal, and things really start to heat up in March. New listings rose 21.2% month-over-month, total active inventory rose 5.4% MoM (to 964K units), days on market dropped from 70 days to 57 days, and the median listing price rose 3% MoM. These are all good (and fairly normal) numbers. No obvious signs of impact from the war (and higher mortgage rates) yet.

Latest housing data from Realtor.com
In March 2026, total active inventory (which excludes homes under contract) rose +5% YoY to 964K units. That was on the back of a 21% MoM rise in new listings. While that sounds like a lot, it’s actually quite normal for March, as sellers list (and relist) properties in advance of the spring/summer high season.
Nationwide active inventory is now 14% below pre-pandemic levels (March 2019). Nationwide median listing prices, meanwhile, were up 3.0% MoM (but still -2.2% YoY) at $415K. Note: Median listing prices are skewed by the mix of properties for sale. A much more accurate measure of home price appreciation — the Case-Shiller national home price index — is showing prices up ~1% YoY currently.

But the charts above mask significant variation at the state and metro level:
State-level Observations
- More than half (31) of the states/districts are seeing year-over-year declines in their median listing prices. Prices are -7.9% YoY in D.C., -6.1% YoY in Massachusetts, -5.4% in Maine and -4.8% in Hawaii.
- States with highest YoY increase in median listing prices were Arkansas +6.7% YoY, Delaware +3.0% YoY, Alabama +2.7% YoY and Mississippi +2.4% YoY. Apart fro Arkansas, that’s not particularly strong price growth.
- In March, there were 12 states/districts whose active inventory is above pre-pandemic levels (Colorado 34% above, Texas +32%, Washington +27%, Tennessee +26%).
- The states where active inventory is still FAR below pre-pandemic levels were: Connecticut -77%, Rhode Island -67%, Illinois -63%, New Jersey -63%, Vermont -60%, Alaska -57%, and New Hampshire -54%.
10 Largest YoY Declines in Median Listing Prices (Mar 2026 vs. Mar 2025)
District of Columbia: -7.9% YoY
Massachusetts: -6.1% YoY
Maine: -5.4% YoY
Hawaii: -4.8% YoY
Texas: -4.1% YoY
Arizona: -4.0% YoY
New York: -3.9% YoY
West Virginia: -3.6% YoY
Wyoming: -3.4% YoY
Florida: -3.2% YoY
10 Largest YoY Increases in Median Listing Prices (Mar 2026 vs. Mar 2025)
Arkansas: +6.7% Yo
Delaware: +3.0% YoY
Alabama: +2.7% YoY
Mississippi: +2.4% YoY
Kansas: +2.1% YoY
Rhode Island: +1.6% YoY
Connecticut: +1.5% YoY
Washington: +1.5% YoY
Ohio: +1.3% YoY
Wisconsin: +1.0% YoY
Dual-axis charts (Median Listing Price vs. Active Inventory) tell the story
I love these charts. You can see the huge drawdown in inventory with the onset of COVID-19, the rebound in inventory as the Fed began raising rates to combat inflation, and the slowdown in price growth as that happened as a result. As an example, here’s the dual-axis chart for Arizona.

TP: I’ve got updated Price vs. Inventory charts for every state and D.C. ready to go. Just ask! (scott@highway.ai).
The Big Three States are Driving National Inventory Trends
Relative to their population, Florida and Texas continue to over-index for listings, while California significantly under-indexes. Florida has more than twice the listing share you’d expect given its population share, while California has half the listing share you expect given its population share.

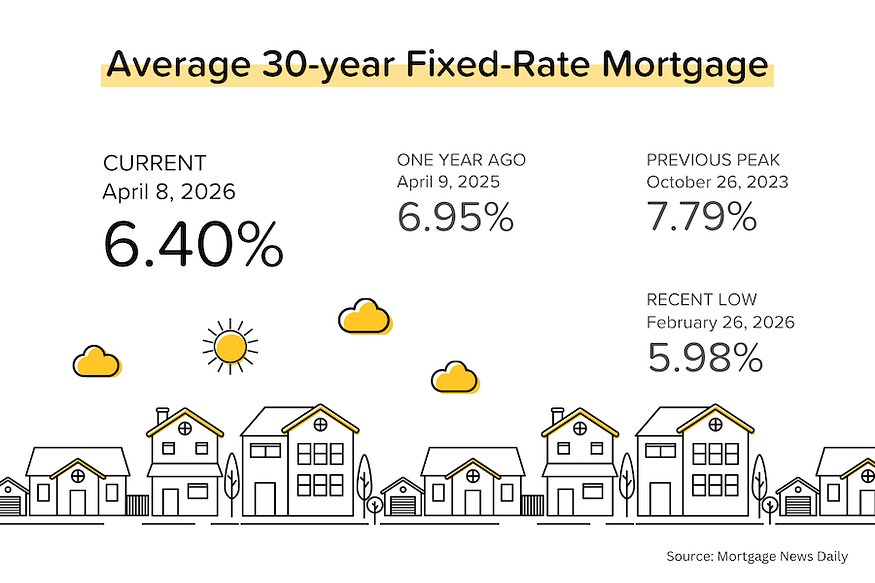
Bond and Mortgage Market
Since peaking around 6.65% on March 27, average 30-year mortgage rates have been trending lower. Now, with the 2-week ceasefire supposedly in place, and ships transiting the Straits of Hormuz again, that downtrend in mortgage rates could continue.
Note: The Fed Funds Rate policy range is currently 3.50–3.75%. The probabilities below come from the CME Group website and are implied from the Fed Funds Rate futures market.
- April 29 FOMC Meeting: 98% probability that the Fed Funds Rate target range is kept at 3.50–3.75% (was 97% last week). And…a 2% probability (was 3% a week ago) that the Fed will raise rates 25 basis points.
- June 17 FOMC Meeting: 94% probability that the Fed Funds Rate will be kept at 3.50–3.75% (unchanged from last week). So, no rate cut at either the April or June meeting.
- No rate cut in 2026? If I look way out to the last FOMC meeting of the year (Dec 9), the market is pricing in a 73% probability (same as last week) that the Fed Funds Rate will be exactly where it is today. In other words, the market continues to price in NO rate cuts for the entirety of 2026. There is only a 14% probability that rates will be 25 basis points below current, and a 12% probability that they will be 25 basis points above current.
They Said It
“Although the steady decrease in mortgage rates prior to the spring homebuying season raised hopes for a rebound in home prices and sales in 2026, the recent surge in rates has reduced demand in the housing market, shifting expectations for a broader recovery this year.” — Dr. Selma Hepp, Cotality’s Chief Economist.
Related posts

The Right Strategy Beats the Lowest Rate


FAQ: Can I buy a home if I recently changed jobs?
.png)
Hiring Misses, Home Prices Climb
Ready to close more deals?
ListReports automatically delivers personalized marketing collateral to your inbox helping you engage with your customers and prospects.