
.jpg)
The government jobs data is starting to flow in, and it seems to be contradicting what we’ve been seeing from private sources like ADP. As a result, hopes are fading for a 3rd Fed rate cut on December 10.
Delayed BLS jobs data for September. The US economy added 119,000 jobs in September, well ahead of Wall Street expectations of +60,000 and a lot better than the 4,000 in job losses experienced in August. However, the unemployment rate rose from 4.3% to 4.4%, and was only a whisker away from being rounded up to 4.5%.

TP: We were supposed to get the September data a month ago. And we don’t get the October or November BLS data until after the Fed’s December 10 meeting. The market now only puts a 40% probability on a rate cut at that meeting.
NAR forecasts 2026 recovery. Existing home sales are predicted to climb 14% year over year to ~4.6 million units. As a reminder, transaction volumes have been stuck at 4 million units for each of the last three years. The NAR also forecasts 4% nationwide price growth in 2026, after +3% in 2025.

TP: NAR was forecasting 9% growth in existing home sales in 2025. We got 0% instead. It’s sort of NAR’s job to be optimistic, but in fairness to them, I expected a recovery in 2025 too.
Existing home sales kept climbing, albeit slowly. In October 2025, existing home sales rose 1.2% month-over-month (+1.7% YoY) to 4.1 million units (SAAR = seasonally adjusted, annualized rate). While that is not much different from the 4 million units SAAR we’ve been seeing for most of the last three years, it is: 1) the highest figure since February 2025, and 2) the fourth-straight month of positive YoY growth. Median listing prices were up 2.1% YoY to $415,200.
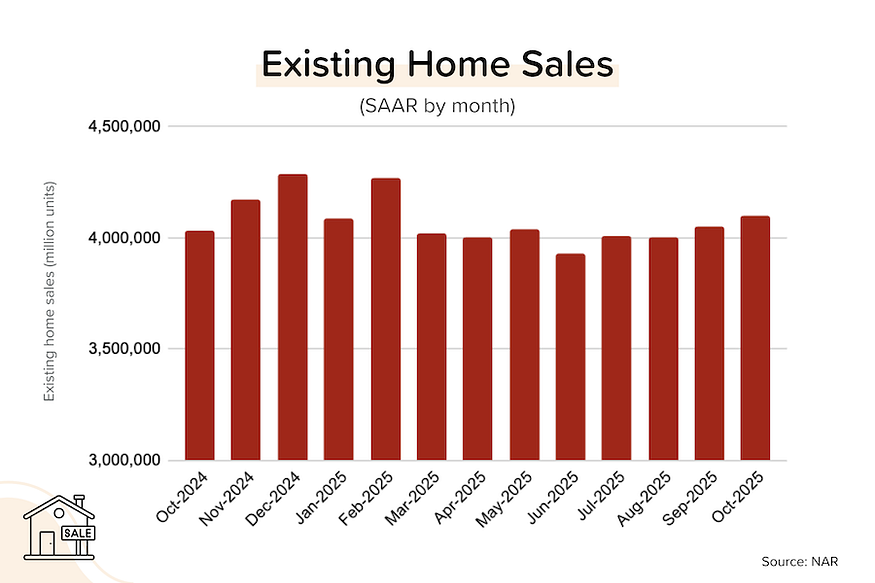
TP: Lower mortgage rates are getting more buyers involved, but the impact has been less than I would have expected. At the end of October 2024, average mortgage rates were 6.92% and we sold 330K existing homes (raw numbers) in the month. At the end of October 2025, average mortgage rates were 6.13% and we sold 358K existing homes in the month (+2.9% YoY).
Builders are cutting prices, and buyers are responding. In November, the National Association of Homebuilders’ confidence index gained 1 point to 38 — still well below the 50 breakeven point between contraction/expansion. With inventory building up, a post-COVID record 41% of builders said that they were cutting prices on new homes.

TP: In the first quarter of 2025, only around 30% of builders were cutting prices.
ADP’s weekly “NER Pulse” report showed continued job losses. Private employers shed an average of 2,500 jobs per week for the four weeks leading up to November 1. While that was better than the 11,250 jobs lost per week leading up to October 25, it’s still consistent with a labor market that is (slowly) going backwards.

TP: When the line above is moving up, job losses are decreasing or job gains are increasing. When it’s moving down, job gains are decreasing or job losses are increasing. Probably the most important thing from this graph is that the average weekly job gain is around ZERO.
Interesting Slides from NAR’s NXT Conference
NAR’s economics team gave a series of presentations at their annual Realtors conference. Here are a few slides that I found particularly interesting:
Huge price gains over the last 5 years. We know this already, of course, but it really drives home the point to see just how many states saw >50% price increases. Did workers’ salaries go up by 50%? No.

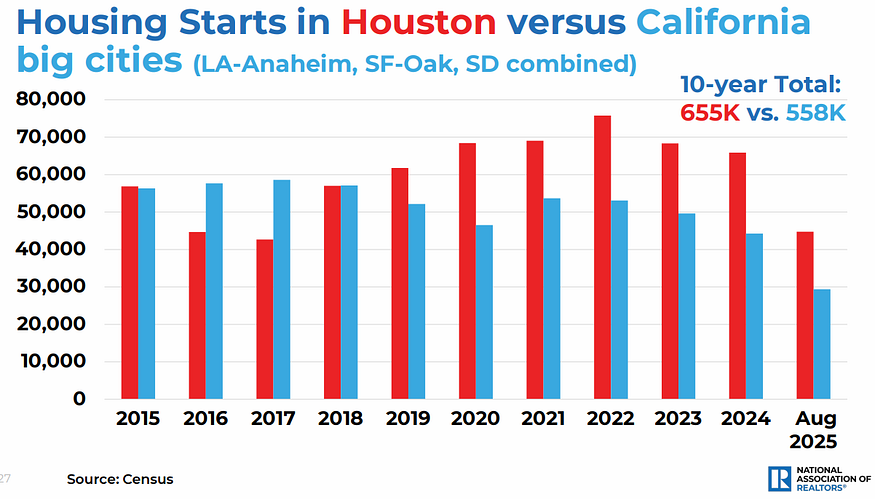
Houston is adding more homes than Los Angeles, San Francisco, and San Diego combined. When it comes to getting new homes permitted, Texas is regulation-light, and California is regulation-heavy. Here are the results.
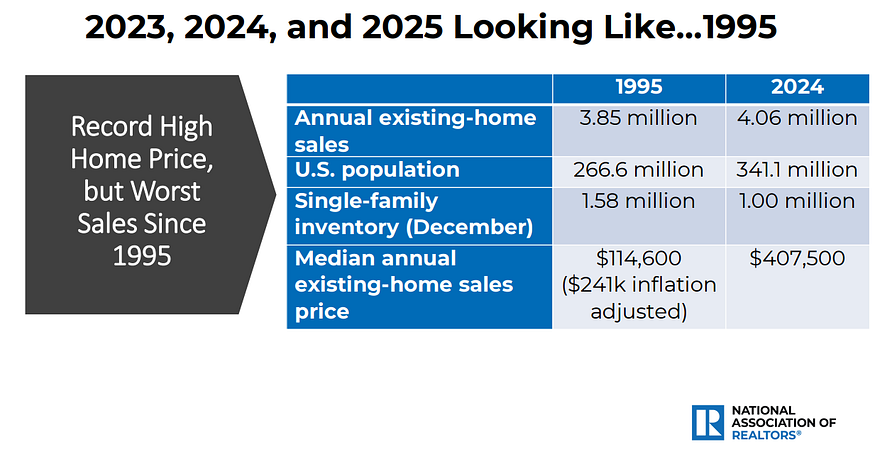
We’re still selling homes like it’s 1995. This can’t last. It’s unsustainably low. As I’ve pointed out many times, the US population has grown by 75 million since 1995, so for us to be selling existing homes at roughly the same pace is wild.
Bond and Mortgage Market
If you add everything up: 1) the “hawkish” minutes from the Fed’s previous meeting, 2) the real-time weekly ADP jobs data, and 3) the just-released September BLS jobs data; you’d come to the conclusion that a Fed rate cut on December 10 is unlikely. We can certainly expect a number of dissenting voices, but it looks like the Fed is finished for 2025.
Note: After the rate cut on Oct 29, the Fed Funds Rate policy range is now 3.75–4.00%. The probabilities below come from the CME Group website and are implied from the Fed Funds Rate futures market.
- December 10 FOMC Meeting: 60% probability that rates will be unchanged (no rate cut). 40% probability that rates will be 25 bps below current (was 91% a month ago).
- January 28 FOMC Meeting: 50% probability that rates will be 25 bps below current (same as last week). That implies a 25 bps rate cut at one, but not both, of the December and January meetings. 20% probability that rates will be 50 bps below current, which implies a rate cut at both the December and January meetings.

They Said It
“While lower mortgage rates are a positive development for affordability conditions, many buyers remain hesitant because of the recent record-long government shutdown and concerns over job security and inflation,” said NAHB Chairman Buddy Hughes, a home builder and developer from Lexington, N.C. “More builders are using incentives to get deals closed, including lowering prices, but many potential buyers still remain on the fence.” — Buddy Hughes, NAHB Chairman
“Home sales increased in October even with the government shutdown due to homebuyers taking advantage of lower mortgage rates. Rents are decelerating which will reduce inflation and encourage the Federal Reserve to continue cutting rates and pulling back their quantitative tightening. This will help bring more homebuyers into the market since the Fed rate has an indirect impact on mortgage rates.” — Lawrence Yun, NAR Chief Economist
Related posts
.jpg)
Weekend Talking Points - 'High Fives'


FAQ: Is now a good time to buy a home?
.png)
Delayed Housing, Inflation and GDP Data Released
Ready to close more deals?
ListReports automatically delivers personalized marketing collateral to your inbox helping you engage with your customers and prospects.