
.jpg)
An already lackluster “jobs week” ended with a bang: the BLS jobs report showed that the US economy added just 22K jobs in August — well below expectations. That convinced the market that at least 2, and possibly 3, Fed rate cuts will happen before year-end.
Weak August BLS jobs report. The US economy added just 22,000 jobs in August, and the previously reported figure for June was revised down to a negative number (-13,000). That’s the first time that the number of jobs has declined month-over-month in over 50 months! The narrow unemployment rate (U-3) climbed from 4.2% → 4.3%, while the broader ‘underemployment rate’ (U-6) jumped from 7.9% → 8.1%. [BLS]

TP: The BLS report often delivers a mixed message: some good, some bad. Not this time: the fingerprints of a deteriorating job market were all over this report.
Bond yields (and mortgage rates) dropped. The market is now convinced that the Fed will cut rates at least 2, and possibly 3, times before year-end. Bond prices jumped, which arithmetically means that bond yields fell. The yield on the 10-year US treasury bond approached 4% (it was at 4.8% in Jan 2025!), and average mortgage rates plunged below 6.3%. [CME]
TP: The market anticipates rate cuts — that’s how it has always worked. But many consumers probably think that they should wait for the Fed meeting before considering a refi or purchasing a new home. Not true. In fact, the market has ALREADY priced in 1–2 rate cuts.
QCEW report cut job growth in half. The Quarterly Census of Employment and Wages for the first quarter of 2025 (end-March) revised down the BLS’ employment figures by 911,000 jobs. If that sounds like a big number, it is. Between April 2024-March 2025, the BLS previously reported that the US had added 1.78 million jobs (~150K/month). Now the QCEW is saying that half of that growth was a statistical mirage. Removing 911K from the total is equivalent to reducing job growth by ~76K/month. [BLS]
TP: Confused between the (large, and usually negative) monthly revisions we get from the BLS and this giant QCEW revision? Here’s the way to think about it: the BLS makes monthly estimates based on its surveys, and then the (much broader) QCEW report comes along later to make corrections. QCEW is “The Mother of All Revisions”.
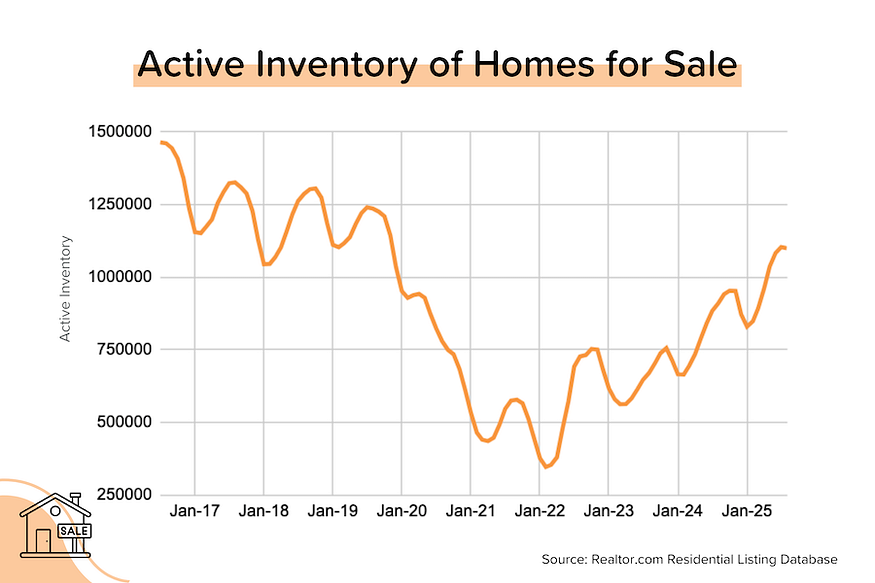
Rapid inventory growth begins to slow. The number of homes for sale nationwide (active inventory = listed homes that aren’t yet under contract) dropped a slight 0.4% month-over-month in August to 1.1 million units. That’s still 11% below nationwide pre-pandemic levels, but the inventory situation at the state level ranges from still-tight (Northeast & Midwest) to amply-supplied (South & West). For example, Florida’s active inventory is 25% above pre-pandemic levels. [Realtor.com]
Realtor.com’s Market Data for August 2025
In August 2025, total active inventory (which excludes homes under contract) rose just +21% to 1.1 million units. That’s a pretty big deceleration from +32% YoY in May 2025. At the national level, active inventory is currently 11% below pre-pandemic levels. Median listing prices, meanwhile, are down YoY for more than half of the Top 100 (and Top 200) metros by population. But the declines in most metropolitan areas are fairly modest.
- In August 2025, 59% of the Top 100 metros had median listings prices that were down year-over-year (August 2025 vs. August 2024), with a median decline of around 2.3%. Looking at the next 100 cities (101–200), 55% had a YoY decline with a median drop of 2.7%.
- The biggest YoY declines in listing prices were seen in Cape Coral-Ft Myers (-8.0%), Honolulu (-7.7%), LA/Long Beach (-7.6%), Durham NC (-7.0%), Miami-Ft Lauderdale (-5.7%), Des Moines (-5.4%), and Austin (-5.0%).
- The Top 100 cities have 66% of the nation’s active inventory. The Top 200 cities have 80% of the nation’s active inventory.
- The total active inventory for the Top 100 cities in Aug 2025 was 10% below pre-pandemic levels (Aug 2019). The total active inventory for the next 100 cities was 7% below pre-pandemic levels.
Inventory remains concentrated in a few states. Florida and Texas alone represent 28% of the total active inventory in the country, despite only having 15% of the population. And both states’ inventory levels are 25–32% above May 2019 levels. (Note: In May 2019, Florida and Texas had just 20% of the total active inventory in the country).
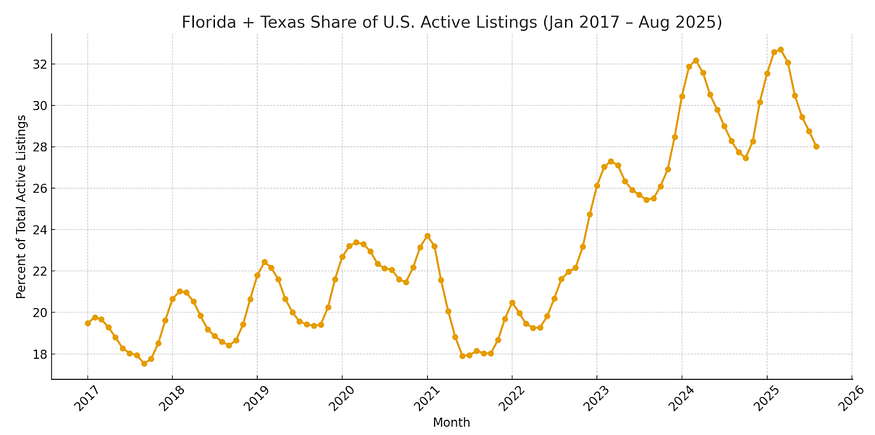
It’s a totally different situation for New York State and Pennsylvania, where inventory levels are still 40–45% below pre-pandemic levels.

Inventory Levels for the Seven Largest States by Population
Relative to their population, Florida and Texas both over-index for listings, while California significantly under-indexes. In other words, California should have a lot more listings than it has, given that it is still the largest state by population. Texas has nearly twice as many active listings as California does!

There are currently 14 states with inventory levels (August 2025) that are ABOVE pre-pandemic levels (August 2019). You’ll notice that the majority of these states are in the South or the mountain West. You may also recall that most of these states benefited heavily from pandemic-era migration trends AND saw huge home price movements between 2020–2022.
14 States with Inventory Levels (Aug 2025) ABOVE Pre-Pandemic Levels (Aug 2019)
Tennessee: +32.9%
Texas: +31.8%
Colorado: +29.2%
Washington: +27.5%
Arizona: +26.7%
Florida: +25.0%
Idaho: +22.0%
Utah: +21.5%
Oklahoma: +5.0%
Hawaii: +4.6%
Nebraska: +3.6%
Nevada: +1.5%
Oregon: +1.5%
Alabama: +0.6%
So are home price trends reflecting the supply situation in these states? In general, yes. There are currently 22 states where median listing prices are DOWN year-over-year, and the majority of those were also in the list above (had inventory above pre-pandemic levels). That said, the declines are pretty modest considering how much home prices rose during COVID.
States where Median Listing Prices are Falling YoY (Aug 2025 vs. Aug 2019)
Hawaii: -7.4% YoY
Iowa: -4.9% YoY
New Jersey: -4.3% YoY
Delaware: -4.0% YoY
Arizona: -3.2% YoY
Massachusetts: -2.8% YoY
California: -2.6% YoY
Colorado: -2.5% YoY
Texas: -2.4% YoY
Florida: -2.3% YoY
Not shown: IL, MN, MS, OR, UT, MT, SD, KS, NE, GA, NV, WA (all down <2% YoY)
Bond and Mortgage Market
After the release of the August BLS jobs report, bond markets went from pricing in 1–2 rate cuts before year-end, to 2–3 rate cuts. A few days later, the QCEW report showed that jobs growth was even weaker than previously reported, but bond prices failed to rally further. Average mortgage rates have moved to just below 6.3%.
Here’s what the market is currently expecting from the final three FOMC meetings of the year:
Note: The current Fed Funds Rate policy range is 4.25–4.50%.
- September 17 FOMC Meeting: 92% probability of a 25 bps rate cut (down from 97% a week ago).
- October 29 FOMC Meeting: 79% probability that rates will be at least 50 bps below current (up from 57% a week ago). That implies 25 bps rate cuts at both the September and October meetings. 21% probability that rates will be 25 bps below current (implying a rate cut in either September or October, but not both).
- December 10 FOMC Meeting: 69% probability that rates will be at least 75 bps below current. That implies a 25 bps rate cut at each of the three meetings before year-end.

They Said It
“This was a huge revision. In fact, it is the largest QCEW revision on record. Nearly half of the jobs we thought we had were never there.” — Barry Habib, Founder & CEO of Highway.ai
Related posts
.png)
Inflation Below Forecasts, Home Sales Rise

.jpg)
Weekend Talking Points - 'Treat'
.png)
Home Builder Confidence Hits 6-Month High
Ready to close more deals?
ListReports automatically delivers personalized marketing collateral to your inbox helping you engage with your customers and prospects.