
.jpg)
A very busy week with the FMOC meeting, jobs data (JOLTs, ADP), and inflation (PCE). Unfortunately, the numbers largely supported the Fed’s “wait and see” approach: private job growth rebounded and annual inflation rose.
Fed kept rates on hold, but not everyone agreed. As expected, the Federal Reserve held its policy rate range steady at 4.25–4.50%. But unusually for the consensus-loving Fed, two voters (Christopher Waller and Michelle Bowman) dissented. They wanted a 25 basis point (0.25% = one quarter of a percentage point) cut instead. [Federal Reserve]
TP: Most of the FOMC (Federal Open Markets Committee) votes are unanimous. It’s rare for even a single member to publicly dissent. Why? Because the Fed chairman wants to create the appearance of 100% agreement with the decision — even if there is a lot of debate going on behind the scenes. That’s why having two voters dissent is shocking, at least by Fed standards. If you’d like to learn more about how the Fed works, I highly encourage you to read Danielle DiMartino Booth’s “Fed Up”.

Pending sales edged lower. In June, contract signings for existing homes fell 0.8% month-over-month (-2.8% year-over-year) despite a rise in the number of homes available for sale. The Pending Home Sales Index is now at 72. To put that in perspective, an index level of 100 is consistent with existing home sales in 2001! [NAR]
TP: We’re still “stuck” at a pace of around 4 million existing home sales. A more normal rate given the size of our population would be 5.0–5.5 million units. We are overdue a snapback in transaction volumes, and just need a little help to get there (30-yr mortgage rates below 6.5% + eliminating capital gains taxes on primary home sales?)
Apartment vacancies hit a new high. Apartment List said that typical rates rose 0.6% in June, cooler than you’d expect for this time of year. That meant that typical rents were down 0.8% year-over-year. With the completion of multifamily units running very hot in 2024 and 2025, the vacancy rate has risen to 7.1%, the highest level since Apartment List started tracking the data in 2017.
TP: The majority of these new units were built in the Sun Belt, where the inventory of existing homes for sale is generally already well above pre-pandemic levels. Which cities have seen the strongest growth in new home permits issued? Denver, Phoenix, San Antonio, Salt Lake City, Raleigh, and Dallas. Not coincidentally, these are also the cities seeing the biggest declines in rental rates.
“The weirdest GDP report ever.” That was the Wall Street Journal’s title for their article on the 2Q GDP report. Why was it so strange? Because the surprisingly strong figure (+3.0% YoY) happened mainly because imports collapsed! Confused? Remember the formula:
GDP = Consumption + Investment + Government + Net Exports (EXports minus IMports)
or
GDP = C + I + G + (X-M)
Since the US has had a trade deficit (X > M) for decades, that last term (X-M) in the GDP equation is negative. In other words, our net exports are a DRAG on overall GDP. In 1Q 2025, GDP fell at a 0.5% YoY pace, mainly because imports surged (+38% QoQ) as companies and individuals tried to front-run Trump’s tariffs. More imports = bigger drag on GDP. In 2Q 2025, that reversed, with imports falling 30% QoQ. Less imports = much smaller drag on GDP. [BEA]
TP: The tariffs have made the GDP report pretty messy. But I’d make two important observations: 1) the average GDP growth in the first half of 2025 has been 1.25% (average of -0.5% & 3.0%), and 2) Neither Consumption (~68% of GDP) nor Investment (~18% of GDP) have been growing that strongly.
JOLTs: Job openings contracted. That’s right, it’s jobs week again! We started with the Job Openings and Labor Turnover Survey, which showed that employers had 7.4 million job openings in May, down 4% from 7.7 million in April. Both hiring and firing activity remained very low. Companies aren’t confident enough to hire more workers, and workers aren’t certain they can find better pay elsewhere. [BLS]
ADP: Private job growth rebounded. Private employers added 104K jobs in June. That was better than expected (~75K) and a significant improvement from the 23K jobs LOST in May. Wage growth stayed at +4.4% YoY. [ADP]
BLS: Coming out today. Over the past few years, the correlation between the ADP employment report and the BLS jobs report has been very unstable. Last month was a perfect example: ADP showed a 23K net loss of jobs, while BLS reported 147K job gains. That makes Friday’s BLS report very hard to predict. The market is looking for ~110K job gains and a 4.2% unemployment rate.
PCE (inflation) moves slightly higher. “Headline” PCE rose 0.3% MoM in June, causing the annual rate of inflation to rise from 2.4% → 2.6%. “Core” PCE also rose 0.3% MoM, with annual inflation flattish at 2.8%. Annualizing the last 6 months of monthly “core” PCE data, you get 3.1%, still well above the 2.0% target. [BLS]
Capital gains tax reform has momentum. In February, we had the bipartisan More Homes on the Market Act, which (among other things) aimed to double the exclusion for capital gains taxes on the sale of primary residences. Then in July, we had the Republican-sponsored No Tax on Home Sales Act, which aimed to eliminate capital gains taxes on primary home sales entirely. Even more recently, President Trump publicly said that “We are thinking about no tax on capital gains on houses.”
TP: According to NAR analysis, roughly 29 million people (34% of homeowners) would pay capital gains taxes on (at least some) of the proceeds if they were to sell their home today. So obviously, that could represent huge tax savings. But more importantly, eliminating capital gains taxes could remove a powerful disincentive to sell, hopefully increasing the supply of homes available for purchase.
On the Case (Shiller) Yet Again
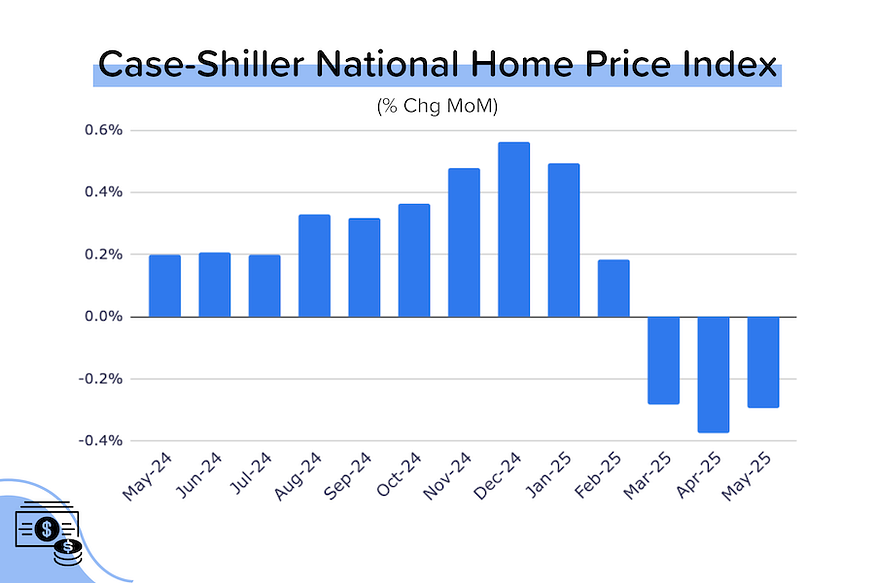
The May 2025 Case-Shiller numbers continued recent trends: a very subdued spring/summer, with home price growth still positive month-over-month (on a raw basis), but much weaker than normal for this time of year (resulting in negative SA figures).
The raw (unadjusted) national index rose 0.4% MoM in May. That means that, in the real world, prices are still increasing. However, the SA national index fell 0.3% MoM in May (it was also down 0.4% MoM in April). As a result, year-over-year growth in the SA index declined to +2.2% in May (from +2.7% in April). Price growth is definitely decelerating. And it’s broadening too.
As we do each month, we looked at the 20 big city indexes in detail. Here’s what we found:
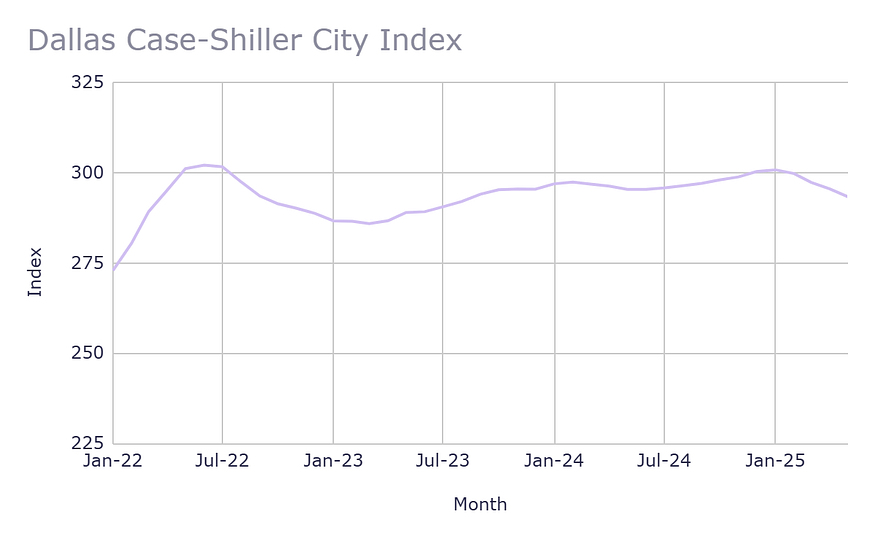
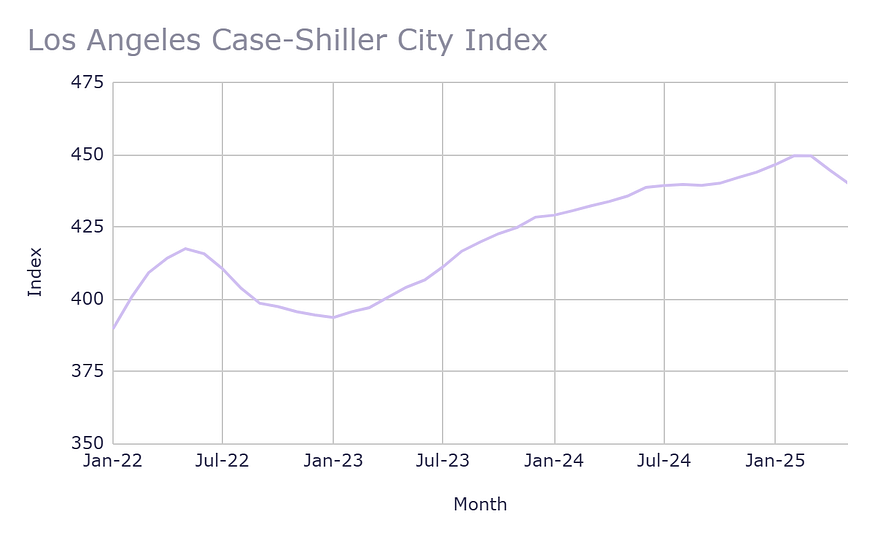
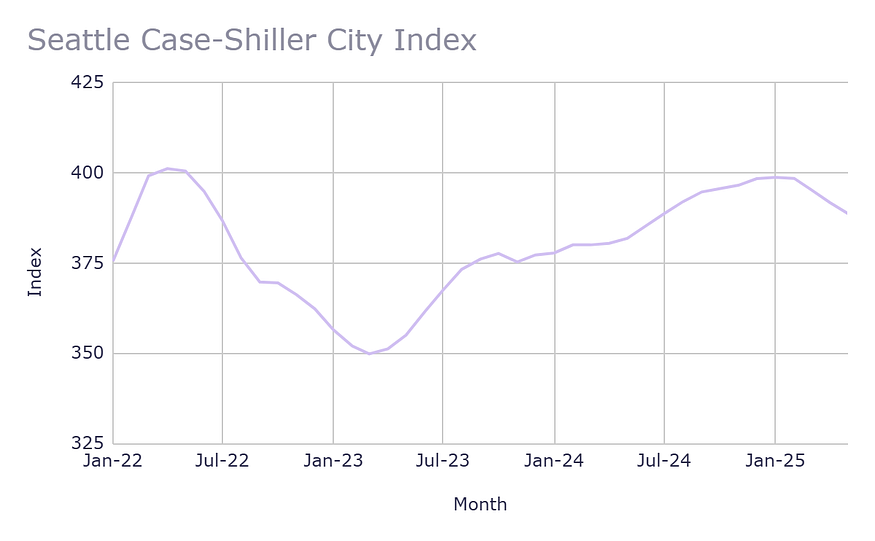
- 12 of the 20 big city indexes saw their SA indexes decline MoM in May (down from 15 last month): The largest drops were seen in Los Angeles (-1.0% MoM), San Francisco (-0.8% MoM), Seattle (-0.8% MoM), Phoenix (-0.8% MoM) and Dallas (- 0.7% MoM).
- The biggest MoM increases came from Boston (+0.5% MoM) and New York City (+0.3% MoM), while the highest annual growth came from New York City (+7.3% YoY) and Chicago (+6.1% YoY). As we are seeing from other data sources, the Northeast and the Midwest regions are where inventory levels are still low and price growth is still strong.
- Four cities are now seeing YoY price declines in their SA indexes (from 2 last month): Tampa (-2.5% YoY) and Dallas (-0.7% YoY) was joined this month by San Francisco (-0.7% YoY) and Denver (-0.1% YoY). Keep in mind, however, that Tampa prices rose 69% between end-2019 and end-2024, and Dallas prices were up 54% over the same time period.
- Only four cities are still making all-time highs: New York, Chicago, Cleveland and Detroit. There are 6 cities that never fully-recovered from their 2H 2022 price drops (Dallas, Denver, Portland, San Francisco and Seattle) and ten others that have seen their indexes slip lower in recent months.
Reminder: The Case-Shiller index is the gold standard for measuring home price growth because it uses the repeat sales method (looking at ‘pairs’ of transactions for the same home) to more accurately gauge true appreciation. However, this accuracy comes at a cost: a nearly two-month time lag.
Should we be Concerned about these Price Drops?
Not at the moment. What we are seeing today is orderly and generally linked to: 1) home price performance over the last 5 years, and 2) current inventory levels. As someone who analyzed the stock market for 20 years, I would categorize this as a very modest correction. Corrections can be very healthy for markets in the longer-term: they reestablish balance between supply and demand.
Prices aren’t falling everywhere. In fact, they aren’t falling in most cities. And the markets where they are falling generally exhibit three attributes: 1) inventory levels already well above pre-pandemic levels, 2) significant new home construction, and 3) major home price growth between 2019–2024. It’s hard to feel bad about prices falling 3% when they rose 60% during the pandemic.
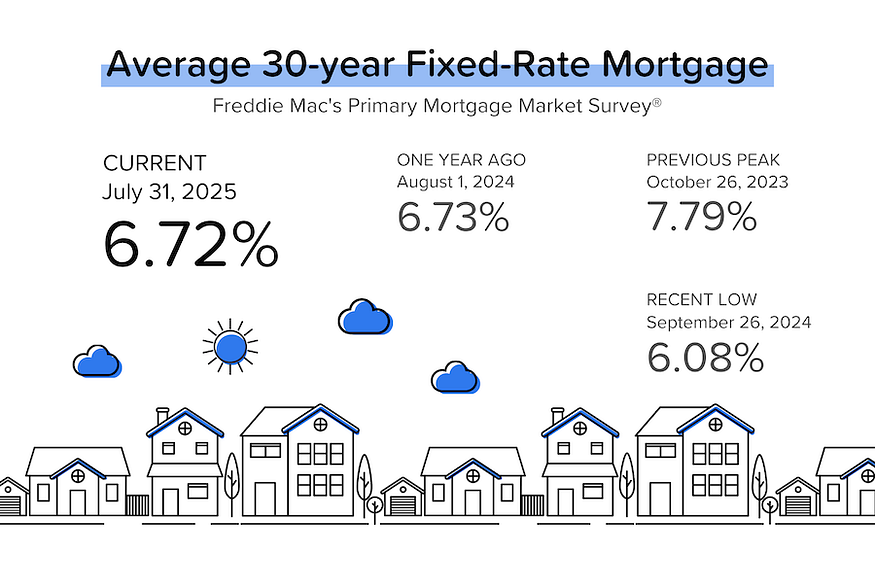
And, of course, 30-yr mortgage rates hovering around 7% aren’t helping with affordability. But as we’ve seen, the “lock-in” effect is fading (at some point you just have to move), there is more inventory for buyers to choose from, and if mortgage rates dropped below 6.5% (only 30–40 bps below current), recent history shows that we’d see demand pick up significantly.
Bond and Mortgage Market
You might think that two people dissenting at the latest FOMC meeting might INCREASE the probability of rate cuts at the upcoming meetings. Instead, the opposite happened. That’s because Fed Chairman Jerome Powell delivered some fairly hawkish commentary at his post-meeting press conference. In a nutshell, he said that uncertainty remained high and that the impact of tariffs would be more noticeable in the inflation figures in coming months.
Here’s what the Fed Funds Rate futures market is currently pricing in for rate cuts. A rate cut at the September meeting is now no longer fully priced-in. Note that the current Fed Funds Rate policy range is 4.25–4.50%.
- September 17 FOMC Meeting: Only a 39% probability that rates will be 25 bps below current (down from 61% a week ago)! 61% probability that rates will remain at 4.25–4.50%.
- October 29 FOMC Meeting: 38% probability that rates will remain at 4.25–4.50%. 48% probability that rates will be 25 bps below current. 15% probability that rates will be 50 bps below current.
- December 10 FOMC Meeting: 41% probability that rates will be 25 bps below current. 35% probability that rates will be 50 bps below current (same as last week). 19% probability that rates will remain at 4.25–4.50%
They Said It
“Higher tariffs have begun to show through more clearly to prices of some goods, but their overall effects on economic activity and inflation remain to be seen…Our obligation is to keep longer term inflation expectations well anchored and to prevent a one-time increase in the price level [the Trump tariffs] from becoming an ongoing inflation problem. For the time being, we’re well positioned to learn more about the likely course of the economy and the evolving balance of risks before adjusting our policy stance. We see our current policy stance as appropriate to guard against inflation risks.” — Jerome Powell, Federal Reserve Chairman
Related posts
.png)
Job Market Slows, Inflation Meets Estimates

.jpg)
Weekend Talking Points - 'Convinced'
.jpg)
Cooling Job Market Fuels Fed Pivot
Ready to close more deals?
ListReports automatically delivers personalized marketing collateral to your inbox helping you engage with your customers and prospects.