
.jpg)
This has been one of the weakest ‘jobs week’ in several years, with multiple sources (ADP, JOLTs, Challenger) consistently pointing to a much weaker labor market. Fed rate cut probabilities are rising, and average mortgage rates remain in the low 6% range.
Weak ADP jobs numbers. Due to the partial government shutdown, we didn’t get the JOLTs report on Tuesday (it came on Thursday), and we won’t get the BLS jobs numbers on Friday (they’ll come next Wednesday). As a result, the ADP figures assumed even greater importance…and they were lousy. Private employers added just 22,000 net jobs in January (about half of Wall Street expectations), and revisions made to match the new QCEW benchmarks lowered total 2025 annual job growth from +614K → +398K (-35%)! [ADP]

TP: On ADP’s revised numbers, private employers added an average of 33K jobs/month over the course of 2025, down from +64K/month in 2024 and +177K/month in 2023. Let’s put that in perspective: according to the BLS, the US labor force is 171 million people, with 164 million currently employed. That means that adding +398K jobs is equivalent to 0.2% growth year-over-year. Basically, nothing.
Largest January job cuts since 2009. According to the Challenger report, employers cut 108K jobs in January 2026, more than double the amount in January 2025. It’s normal for layoffs to surge at the start of the year, but “this is a high total for January…signaling employers are less-than-optimistic about the outlook for 2026.” [Challenger, Gray & Christmas]
Big drop in job openings. The JOLTS report showed that job openings dropped precipitously in December 2025 (-6% MoM and -13% YoY) to 6.5 million. That was much lower than expected, and is actually the lowest job openings figure we’ve seen since September 2020. The hiring and firing rates both remained very low by historical standards.
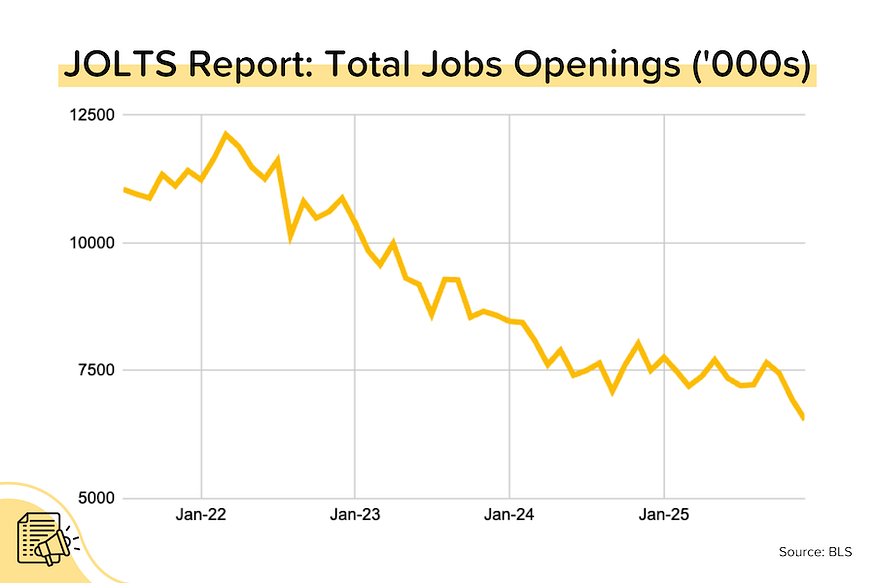
TP: You’ve really got to wonder what some of the Fed members are thinking. ADP is showing basically no private employment growth. BLS has had huge downward revisions. Challenger is showing elevated layoffs. JOLTS is reporting plunging job openings. The job market is certainly not ‘solid’. It looks fragile to me.
Cotality still bullish on 2026 home price growth. National home price growth slowed to just 0.9% year-over-year in December 2025, but despite this, Cotality is still looking for robust (+4.5% YoY) price growth in 2026. Why the apparent disconnect? Because mortgage rates have come down a lot, and Cotality is seeing fewer and fewer cities where prices are declining.
“[T]here are signs that this deceleration [in price growth] may be leveling off. In December, fewer of the top 100 metros recorded slowing appreciation compared to the previous year — 49 out of 100 compared to 77 earlier in the fall. An important contributor helping home prices level off are lower mortgage rates, which have fallen some 50 basis points since this summer.”
TP: This lines up with what we’ve been seeing from the Case-Shiller big city indexes. In July 2025, 16 of the 20 big city indexes were posting month-over-month declines. In November 2025, only 2 were showing MoM declines.
Homeowner wealth is still rising. In the 4th quarter of 2025, home prices grew year-over-year in 73% of the nation’s 230 largest metros. Overall, price growth was modest at 1.2% YoY, but the median homeowner gained $147K in equity in the last 5 years alone. Even in markets where home prices have recently been moving lower (TX, FL) the equity buffer is still very large. Median Austin homeowner net worth rose by $170K over the last 5 years; and in Miami, by $300K! [NAR]
TP: I keep stressing that last point. Yes, home prices have been trending lower in many cities across the US. But the declines are modest, especially relative to the home price gains during 2020–2022. Improved affordability is a great thing in these markets. Existing homeowners losing a small percentage of their equity gains is not a big deal.
Bond and Mortgage Market
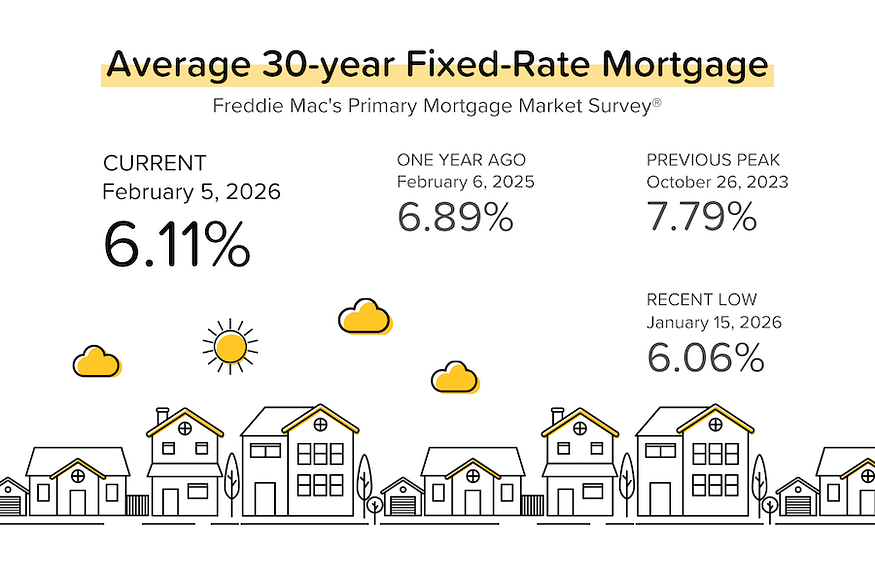
Overall, a quiet week, with average 30-yr mortgage rates staying roughly flat WoW at 6.11%. To be honest, I’m surprised that all the weak jobs data didn’t have more of a positive impact on Treasury yields and mortgage rates. That said, the probabilities for future rate cuts did rise (see below). Remember that the new Fed Chair, Kevin Warsh, won’t be on the job until mid-May.
Note: The Fed Funds Rate policy range is currently 3.50–3.75%. The probabilities below come from the CME Group website and are implied from the Fed Funds Rate futures market.
- March 18 FOMC Meeting: 76% probability that the Fed Funds Rate target range is kept at 3.50–3.75% (down from 87% a week ago). In other words, no rate cut at the March FOMC meetings. But a growing 24% probability that rates are 25 bps below current (was 13% last week), which would imply a 25 bps rate cut at the March meeting.
- April 29 FOMC Meeting: 59% probability that the Fed Funds Rate target range is kept at 3.50–3.75% (was 71% last week). In other words, no rate cut at EITHER the March or April meeting. 36% probability that rates will be 25% below current (was 27% last week), which implies a 25 bps rate at either the March (unlikely) or April (more likely) meeting.
They Said It
“Job creation took a step back in 2025, with private employers adding 398,000 jobs, down from 771,000 in 2024. While we’ve seen a continuous and dramatic slowdown in job creation for the past three years, wage growth has remained stable.” — Nela Richardson, ADP’s Chief Economist
Related posts

FAQ: Can I buy a home if I have student loan debt?

.jpg)
May 2026 MBS Highway Housing Index
.png)
Mixed Jobs Data, Home Sales Beat Forecasts
Ready to close more deals?
ListReports automatically delivers personalized marketing collateral to your inbox helping you engage with your customers and prospects.