
.jpg)
Despite rising inventory levels, existing home sales remain stuck at a 4 million unit annual pace. Homes are lingering on the market longer, and buyers are regaining some of the negotiating power that they lost during the pandemic. Meanwhile, the market is certain that the Fed will stay on pause next week.
The Federal Reserve will meet next week. On July 30, the Federal Open Markets Committee will meet to discuss the US economy and set interest rate policy. The market overwhelmingly expects that the Fed will keep the Federal Funds Rate target range steady at 4.25%-4.50%. In other words, no rate cut. [Sources: Federal Reserve & CME]
TP: After starting to cut rates in late 2024, the Fed has been on “pause” for all of 2025. Why? First, because inflation (“core” PCE) has failed to make much progress this year. In January 2025, “core” PCE was rising at +2.7% year-over-year. And in June 2025? Also +2.7% YoY. The Fed’s target is +2.0%. Second, because the labor market has remained tight, with the latest unemployment rate reading at 4.1%.
Existing home sales remain stuck. In June 2025, existing home sales fell 2.7% month-over-month (flat YoY) to a seasonally-adjusted, annualized pace of 3.93 million units. We’re still selling homes at a pace comparable to 2008 or 1995. The median sales price rose 2.7% MoM (+2.0% YoY) to $435,300. Total inventory was flat at 1.53 million units. At the current pace of sales, it would take 4.7 months to sell all the inventory — and that’s the highest figure in a long time. [Source: NAR]
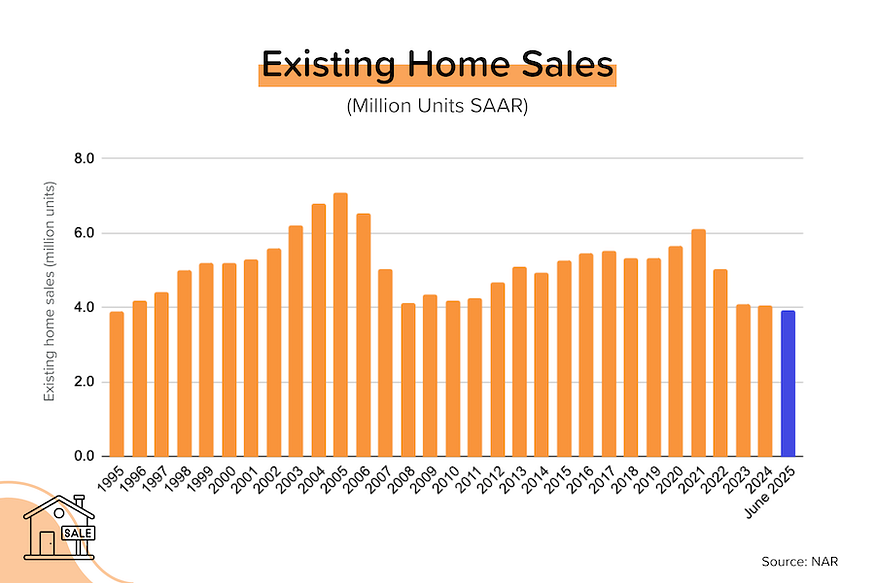
TP: You’ve heard this from me before, but it’s worth repeating — we should be selling homes at a 5.0–5.5 million unit pace. But mortgage rates near 7% are keeping buyers on the sidelines. With inventory levels continuing to rise, that means that listings are sitting on the market longer, and that’s giving buyers more negotiating power — particularly in markets where inventory levels are already well above pre-pandemic levels.
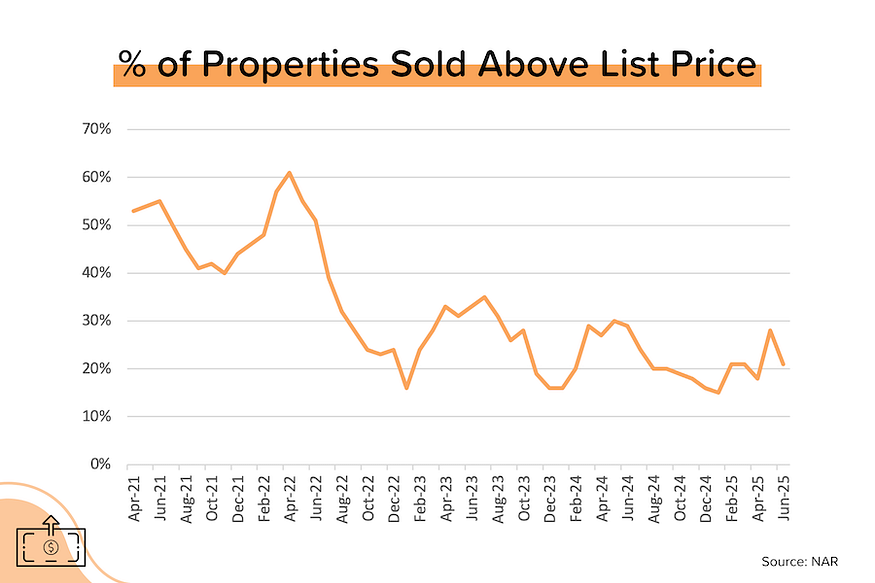
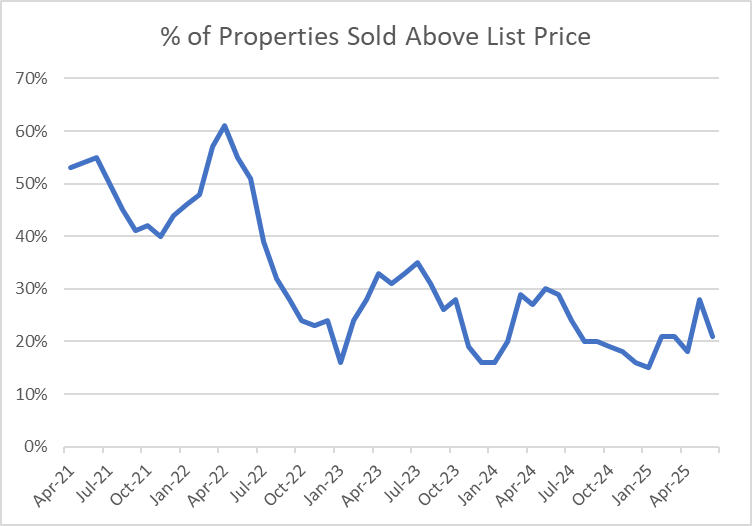
Less competition for homes. In June, the Realtors Confidence Index continued to evidence a cooling market. Only 21% of the homes sold in June 2025 were transacted above the original list price (that figure was 29% in June 2024). And the average number of offers per home sold was 2.4 in June 2025 (vs. 2.9 in June 2024). [Source: NAR]
NAR lowers their outlook. The NAR is now looking for just 3% YoY growth in existing home sales in 2025, and 1% YoY price growth. But they expect a snapback in 2026 driven by lower mortgage rates (6% for a 30-yr mortgage), with existing home sales jumping 14% YoY, and prices rising 4% YoY. [Source: NAR]
Realtors Confidence Index for June 2025
Every month, the NAR surveys Realtors and asks them for a combination of hard and soft data. The results of this Realtors Confidence Index (“RCI”) are released on the same day as the existing home sales figure.
Note: It’s normal for competition levels to begin fading in June (as fall approaches), so it’s important to compare June 2025 to June 2024.
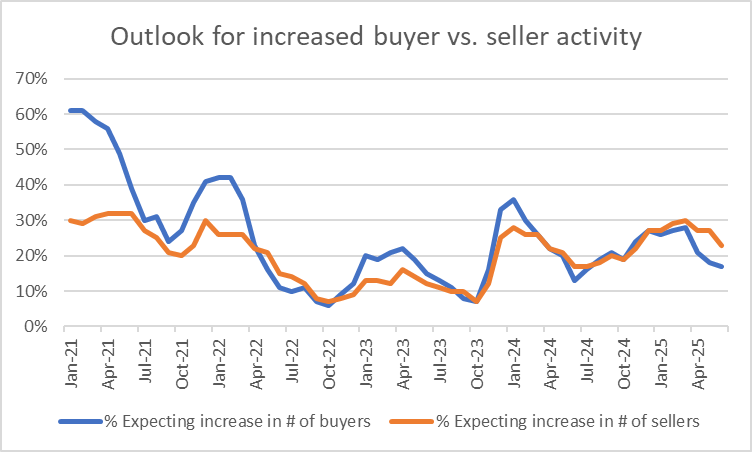
Next Three Months Outlook. In June 2025, just 17% of respondents said that they expected an increase in buyer activity in the next three months. In May 2025, that figure was 18%, and in June 2024 it was 13%. In terms of seller activity, 23% of respondents in June 2025 saw that increasing over the next three months, compared to 17% in June 2024.
TP: This series has very clear seasonality. As we get closer to fall and winter, Realtors expect buyer activity to decline. That said, I find it interesting that the outlook for seller activity continues to outpace buyer activity. That’s another sign of buyers regaining negotiating power.
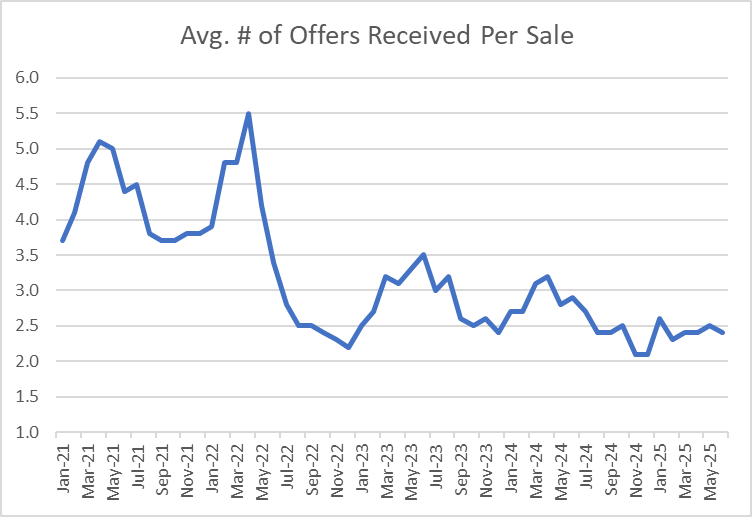
Number of Offers Received per Sale. In June 2025, there was an average of 2.4 offers for every property sold, down from 2.5 in May 2025. But in June 2024, that figure was 2.9, and in June 2023, it was 3.3. Competition for individual properties has eased significantly as inventory has increased (and mortgage rates have risen).
% of Properties Selling Above List Price. In June 2025, 21% of homes sold above their list price, well below the 28% seen in May 2025 and the 29% experienced in June 2024. In June 2022, over 50% of homes sold above their list price! You may have noticed that the graph below looks very similar to the one above. Makes sense, right? When the frequency of competitive biddings is rising, more homes will transact above their list price.
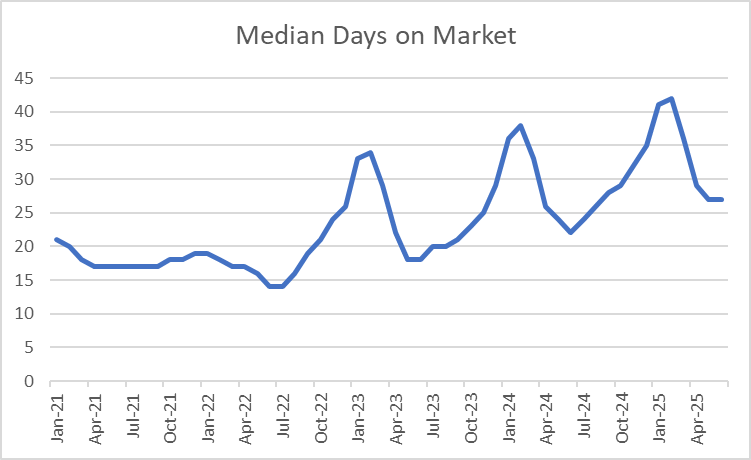
Days on Market. The homes that sold in June 2025 spent a median of 27 days on the market, the same as in May 2025. But that’s one week longer than the 22 days on market seen in June 2024. Remember: a lower DOM implies a faster pace of sales; a higher DOM means that homes are lingering on the market longer, which means that inventory is piling up. In June 2023, DOM was just 18. In June 2022, DOM was 14 — just two weeks!
TP: DOM tends to bottom in May-June (the spring/summer selling season) and peak in Jan-Feb (slower sales in winter). Note the rising peaks and rising troughs in the graph below.
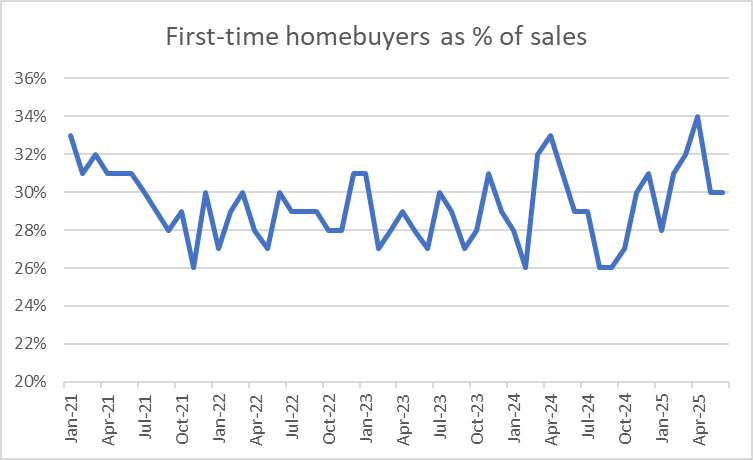
First-timer Buyers. Historically (2008–2018), first-time buyers typically represented ~32% of the homes purchased in a given month. During the pandemic, this got as low as 26% as home prices (and later mortgage rates) moved sharply higher. In June 2025, 30% of homes sold were bought by first-timers, the same as in May 2025. In June 2024, the figure was 29%. Despite high home prices and mortgage rates, first-timers are still finding a way.
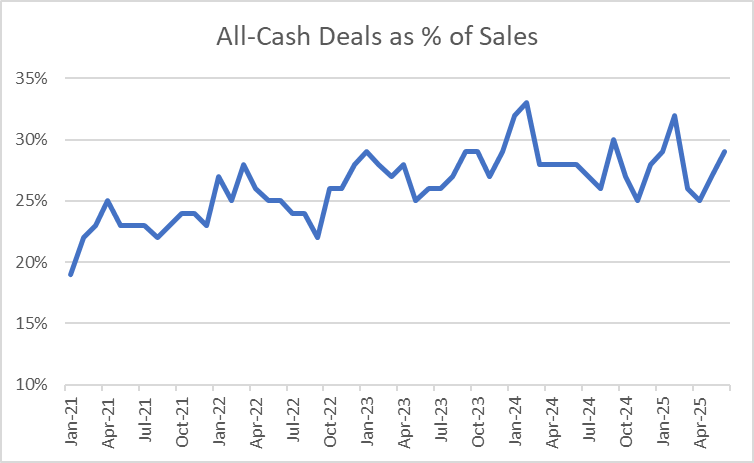
All-cash Deals. When mortgage rates are high, cashed-up buyers (typically older folks and property investment companies) have a huge advantage. In contrast, first-timers are rarely in the position to buy a home without a mortgage. In June 2025, 29% of all homes sold were bought all-cash. This was up from 27% in May 2025, and slightly above the 28% seen in June 2024.
TP: Think about that for a minute: nearly one-third of ALL the homes sold across the US in June were purchased without a mortgage. Incredible!
Bond and Mortgage Market
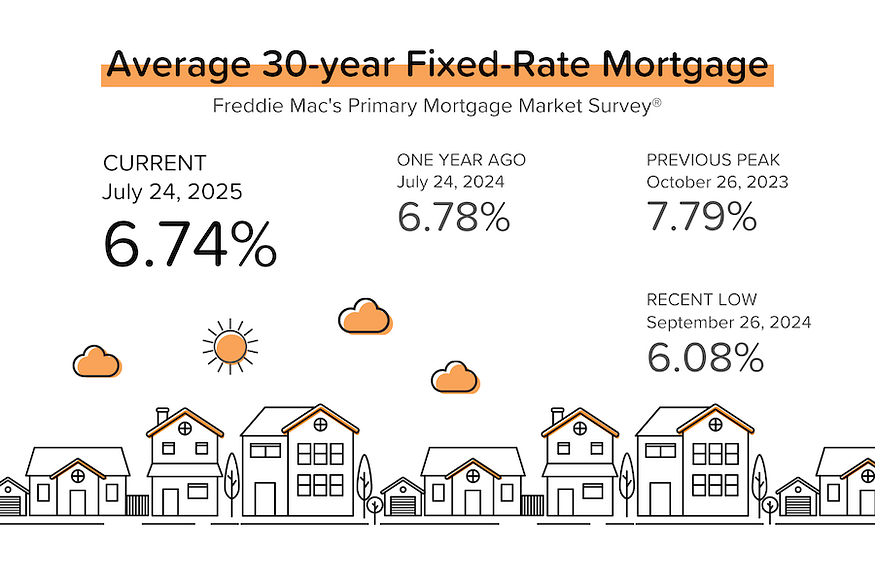
Average 30-year mortgage rates were largely unchanged this week, which was actually surprising considering the huge upward moves in the stock market AND the continued rise in global bond yields (notably Japan).
Here’s what the Fed Funds Rate futures market is currently pricing in for rate cuts. Note that the current Fed Funds Rate policy range is 4.25–4.50%.
- July 30 FOMC Meeting: 97% probability that the policy rate will remain at 4.25–4.50% (up from last week). So no rate cut expected.
- September 17 FOMC Meeting: 61% probability that rates will be 25 bps below current (up from 59%). This implies a 25 bps rate cut at this meeting. 37% probability that rates will remain at 4.25–4.50%.
- October 29 FOMC Meeting: 31% probability that rates will be 50 bps below current (down from 35% last week). 19% probability that rates will remain at 4.25–4.50%.
They Said It
“Multiple years of undersupply are driving the record high home price. Home construction continues to lag population growth. This is holding back first-time home buyers from entering the market. More supply is needed to increase the share of first-time homebuyers in the coming years even though some markets appear to have a temporary oversupply at the moment.” — Lawrence Yun, NAR’s Chief Economist
“The starter home has effectively aged out. What used to be a newbuild on the edge of town is now a decades-old listing — often smaller, still pricey, and receiving fierce competition. First-time buyers are priced out by high mortgage rates or lack of supply. These market conditions are tilting the scales toward renting, an opportunity that investors are happy to pounce on, which in turn creates even more competition for potential buyers.” — Thom Malone, Cotality Economist
Related posts
.jpg)
Weekend Talking Points - 'Convinced'

.jpg)
Cooling Job Market Fuels Fed Pivot
September 2025 MBS Highway Housing Index
Ready to close more deals?
ListReports automatically delivers personalized marketing collateral to your inbox helping you engage with your customers and prospects.